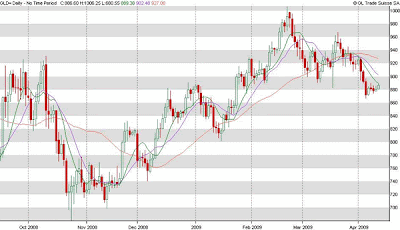
The initial test for Gold today is the shorter term 9 day moving average sitting just above current activity. It could be argued that the gold chart is showing a pennant formation with the beginning of the 'pole' at around $930. Today's activity has pushed us slightly above the short term downtrend line of the pennant and on holding above the 9 day moving average the next big technical target levels are the 14 day m.a. and the aforementioned $930 region. The length of the 'pole' also determines the downside target and on a break of recent lows gold could quickly fall another $60 dollars toward the key support level of $800.
The short term trend is bearish while the medium and long term trends are bullish.
Support: $877.00 (Friday's low)
Resistance: $909.85 (high of 03/04/09)
Support: $871.05 (low of 07/04/09)
Resistance: $896.97 (high of 06/04/09)
Support: $851.90 (low of 23/01/09)
Resistance: $890.02 (high of 08/04/09)

9 day moving average - $889.38
14 day moving average - $902.48
40 day moving average - $927.06


No comments:
Post a Comment