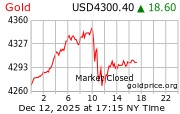
The sell off in gold continued Friday as risk appetite increased and market participants now looking confident that the worst of the panic selling is over. Consequently gold lost another 9 dollars to finish at $867.10/oz. With ongoing strengthening in equities the yellow metal starts to lose its appeal as a safe haven and further selling pressure is expected especially when physically backed gold exchange traded funds are starting to see large outflows.
The short term trend is bearish while the medium and long term trends are bullish.
Support: $864.45 (Friday's low)
Resistance: $885.97 (14 day moving average)
Support: $851.90 (low of 23/01/09)
Resistance: $880.52 (9 day moving average)
Support: $843.25 (low of 22/01/09)
Resistance: $876.50 (Friday's high)

9 day moving average - $880.52
14 day moving average - $885.97
40 day moving average - $914.39


No comments:
Post a Comment