Thursday, April 30, 2009

Today's forecast- Stay on the sidelines.

Gold moved higher yesterday on the back of a weaker US dollar and strengthening in crude oil gaining $3.71 to settle at $894.31/oz. Despite a bigger than expected decline in US gross domestic product the markets focused rather on gains in consumer spending. So the flight to quality buying in gold was limited as strengthening equity markets capped the gains. Consequently the yellow metal didn't increase as much as other commodities with money going into oil instead.
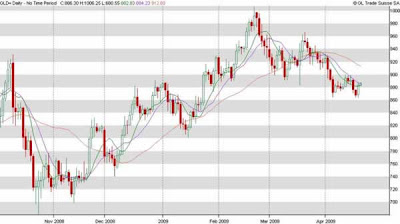
The short term trend is sideways while the medium and long term trends are bullish.

Support: $887.10 (yesterday's low)
Resistance: $922.77 (high of 04/03/09)

Support: $871.50 (low of 16/04/09)
Resistance: $918.50 (high of 27/04/09)

Support: $864.25 (low of 20/04/09)
Resistance: $903.00 (yesterday's high)


9 day moving average - $895.42
14 day moving average - $891.18
40 day moving average - $907.16

Wednesday, April 29, 2009

Today's forecast- Crucial day.

Concerns about a swine flu pandemic have prompted selling in gold which settled at $890.70/oz yesterday losing 14.87 dollars. In addition a drop below the $900.00 level possibly triggered some sell stops accentuating the decline. As the inflation hedge trading seems to be drying up, the yellow metal's inability to draw safe haven flows despite some weakness in the equities was another disappointment for gold investors. Struggling sales in India, the world's biggest gold buyer also provided some bearish influence for the precious metal with imports falling sharply in recent months.
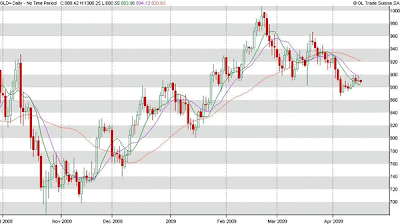
The short term trend is sideways while the medium and long term trends are bullish.

Support: $883.55 (yesterday's low)
Resistance: $922.77 (high of 04/03/09)

Support: $871.50 (low of 16/04/09)
Resistance: $918.50 (high of 27/04/09)

Support: $864.25 (low of 20/04/09)
Resistance: $906.00 (yesterday's high)


9 day moving average - $892.00
14 day moving average - $889.95
40 day moving average - $907.97

Monday, April 27, 2009

Sideways movement for gold today.

Gold's ability to hold above the psychological $900.00 level has pushed the price higher breaching the 40 days moving average. The move was largely interpreted as a technical follow-through from Thursday but it also had fundamental influences including China's announcement that the country now holds over 1000 metric tons in gold reserves, up from 600 tons reported since 2003 fuelling speculation that other central banks may follow suit. In addition, until the release of the US government's methodology of stress tests for banks the markets are likely to stay nervous which in turn is good news for gold.

The short term trend is sideways while the medium and long term trends are bullish.

Support: $903.75 (Friday's low)
Resistance: $929.12 (high of 02/04/09)

Support: $889.45 (yesterday's low)
Resistance: $922.77 (high of 04/03/09)

Support: $881.40 (low of 22/04/09)
Resistance: $913.90 (Friday's high)


9 day moving average - $894.22
14 day moving average - $891.49
40 day moving average - $909.28

Thursday, April 23, 2009

Today's forecast- Gold's out of congestion

Gold moved higher yesterday helped by a lower US dollar and continuing worries about the financial sector given the fast approaching stress test results. Additional support for the yellow metal was provided by the combination of short covering and inflation buying after o housing report showed that US home prices rose in February. A cross between the 9 and 14 day moving averages was shown on the chart and together with a close above these short term M.A. are two bullish signals. We are looking at the $900.00 mark as the next upside target.

The short term trend is bearish while the medium and long term trends are bullish.

Support: $881.40 (yesterday's low)
Resistance: $909.85 (high of 03/04/09)

Support: $864.25 (low of 20/04/09)
Resistance: $899.45 (high of 15/04/09)

Support: $851.90 (low of 23/01/09)
Resistance: $893.50 (yesterday's high)


9 day moving average - $885.29
14 day moving average - $882.89
40 day moving average - $909.98

Wednesday, April 22, 2009

Sideways movement for gold today.

Gold closed marginally lower yesterday on profit taking, losing a mere 90 cents as Dow Jones managed to turn higher. Currently the precious metal and the equities have an inverse relationship with nervous investors buying gold when stocks are down and vice versa liquidating gold positions when sentiment improves pushing equities higher. Some traders pointed out that despite the rebound in the Dow Jones the yellow metal hasn't collapsed and the modest decline could be interpreted as ongoing concerns lurking in the shadow.

The short term trend is bearish while the medium and long term trends are bullish.

Support: $878.55 (yesterday's low)
Resistance: $909.85 (high of 03/04/09)

Support: $864.25 (low of 20/04/09)
Resistance: $899.45 (high of 15/04/09)

Support: $851.90 (low of 23/01/09)
Resistance: $895.20 (yesterday's high)


9 day moving average - $883.02
14 day moving average - $882.23
40 day moving average - $911.06

Tuesday, April 21, 2009

Today's forecast- Buy gold

Renewed concerns about the health of the US banks sent investors back to the comfort of gold yesterday. After being in a down trend recently gold rose sharply on safe haven buying as investors dumped US stocks with short covering being triggered. Technically gold finished the day $15.15 higher breaching and holding above the 9 day moving average. Some analysts also pointed traditional physical demand for jewellery in Asia as a possible factor supporting gold.

The short term trend is bearish while the medium and long term trends are bullish.

Support: $864.25 (yesterday's low)
Resistance: $899.45 (high of 15/04/09)

Support: $851.90 (low of 23/01/09)
Resistance: $893.75 (high of 16/04/09)

Support: $843.25 (low of 22/01/09)
Resistance: $888.45 (yesterday's high)

candelstick chart, technical indicators, share market, stock market, commodity market, accurate forecast, daily gold forecast
9 day moving average - $882.83
14 day moving average - $884.23
40 day moving average - $912.89

Monday, April 20, 2009

Sideways movement for gold today.

The sell off in gold continued Friday as risk appetite increased and market participants now looking confident that the worst of the panic selling is over. Consequently gold lost another 9 dollars to finish at $867.10/oz. With ongoing strengthening in equities the yellow metal starts to lose its appeal as a safe haven and further selling pressure is expected especially when physically backed gold exchange traded funds are starting to see large outflows.

The short term trend is bearish while the medium and long term trends are bullish.

Support: $864.45 (Friday's low)
Resistance: $885.97 (14 day moving average)

Support: $851.90 (low of 23/01/09)
Resistance: $880.52 (9 day moving average)

Support: $843.25 (low of 22/01/09)
Resistance: $876.50 (Friday's high)

candelstick chart, technical indicators, share market, stock market, commodity market, accurate forecast, daily gold forecast
9 day moving average - $880.52
14 day moving average - $885.97
40 day moving average - $914.39

Thursday, April 16, 2009

Today's forecast- Consolidation likely for gold

Initially gold declined yesterday following a lower consumer price report which was indicative of deflation and pressured the yellow metal as an inflation hedge. However the data failed to trigger a sustained downward move with the market participants quickly shrugging off deflationary concerns and rather looking towards another challenge of the psychological $900/oz mark. Although gold finished 2.30 dollars higher some analysts consider that another failed test of the $900 level could soon be followed by more downside movements.

The short term trend is bearish while the medium and long term trends are bullish.

Support: $884.80 (yesterday's low)
Resistance: $913.30 (high of 11/03/09)

Support: $871.05 (low of 07/04/09)
Resistance: $909.85 (high of 03/04/09)

Support: $851.90 (low of 23/01/09)
Resistance: $899.45 (yesterday's high)

candelstick chart, technical indicators, share market, stock market, commodity market, accurate forecast, daily gold forecast
9 day moving average - $883.98
14 day moving average - $894.13
40 day moving average - $920.83

Wednesday, April 15, 2009

Today's forecast- Sell gold around 892

Prices have consolidated quite nicely and this is a very good position to establish a sell position. Trade with a sell position around 892 with a stop loss at 901.

Failure to breach resistance at $900/oz level has triggered profit taking in gold yesterday and as a result it settled 5.5 dollars down for the day. In addition to a slightly higher US dollar, economic data also pushed the yellow metal down after reports from the Labour Department showed inflation falling more sharply than anticipated signalling further economic weakness. Gold is often bought as a hedge against rising prices so fading inflation usually has a negative impact on the precious metal's price.

The short term trend is bearish while the medium and long term trends are bullish.

Support: $885.70 (yesterday's low)
Resistance: $913.30 (high of 11/03/09)

Support: $871.05 (low of 07/04/09)
Resistance: $909.85 (high of 03/04/09)

Support: $851.90 (low of 23/01/09)
Resistance: $898.40 (yesterday's high)

candelstick chart, technical indicators, share market, stock market, commodity market, accurate forecast, daily gold forecast

9 day moving average - $884.33
14 day moving average - $896.64
40 day moving average - $923.02

Tuesday, April 14, 2009

Remain on the sidelines.

Gold finished higher yesterday gaining $13.65 to settle at $894.30 and managed to cross above the 9 day moving average. The move was driven by lower equity markets and a weaker US dollar and accentuated by worries about General Motors after reports from the US Treasury directing GM to lay the foundation for a bankruptcy filing by June 1st deadline. That in turn triggered safe haven buying with some analysts indicating the yellow metal was due for a bounce anyway considering that lately gold was a bit oversold.

The short term trend is bearish while the medium and long term trends are bullish.

Support: $880.65 (yesterday's low)
Resistance: $913.30 (high of 11/03/09)

Support: $871.05 (low of 07/04/09)
Resistance: $909.85 (high of 03/04/09)

Support: $851.90 (low of 23/01/09)
Resistance: $899.75 (yesterday's high)

candelstick chart, technical indicators, share market, stock market, commodity market, accurate forecast, daily gold forecast
9 day moving average - $886.95
14 day moving average - $900.26
40 day moving average - $925.46

Monday, April 13, 2009

Today's forecast for gold- sideways movements.

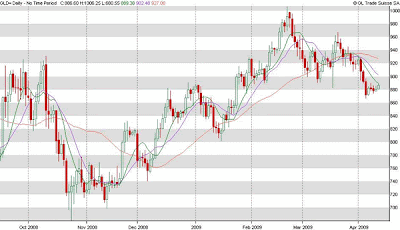
The initial test for Gold today is the shorter term 9 day moving average sitting just above current activity. It could be argued that the gold chart is showing a pennant formation with the beginning of the 'pole' at around $930. Today's activity has pushed us slightly above the short term downtrend line of the pennant and on holding above the 9 day moving average the next big technical target levels are the 14 day m.a. and the aforementioned $930 region. The length of the 'pole' also determines the downside target and on a break of recent lows gold could quickly fall another $60 dollars toward the key support level of $800.

The short term trend is bearish while the medium and long term trends are bullish.

Support: $877.00 (Friday's low)
Resistance: $909.85 (high of 03/04/09)

Support: $871.05 (low of 07/04/09)
Resistance: $896.97 (high of 06/04/09)

Support: $851.90 (low of 23/01/09)
Resistance: $890.02 (high of 08/04/09)

candelstick chart, technical indicators, share market, stock market, commodity market, accurate forecast, daily gold forecast
9 day moving average - $889.38
14 day moving average - $902.48
40 day moving average - $927.06

Thursday, April 9, 2009

Today's forecast- Sell for good profit booking

Now, gold price has consolidated too much and is prone to a large decline from hereon. Any rally can be used as an opportunity for a good profit booking. So, don't miss the opportunity. Trade with a sell position around 882 levels.

Today's gold trend: Down
Next target: 850

Gold went higher in early trading as a poor start to the companies earning season reignited some risk aversion buying. In addition, following recent declines bargain hunting kicked in bringing new buyers into the gold market. Later on the FOMC minutes described more economic gloom but failed to mention concerns about inflation so gold gave back the initial gains finishing the day 2.25 dollars lower. The yellow metal acts as an inflation hedge but with many countries already in recession at least on the short term inflation worries are fading.

The short term trend is bearish while the medium and long term trends are bullish.

Support: $877.90 (yesterday's low)
Resistance: $909.85 (high of 03/04/09)

Support: $871.05 (low of 07/04/09)
Resistance: $896.97 (high of 06/04/09)

Support: $851.90 (low of 23/01/09)
Resistance: $890.02 (yesterday's high)

candelstick chart, technical indicators, share market, stock market, commodity market, accurate forecast, daily gold forecast
9 day moving average - $898.09
14 day moving average - $912.45
40 day moving average - $930.64

Tuesday, April 7, 2009

Forecast for gold today is slight consolidation before going down again.

Gold fell quite sharply yesterday as forecast. Now a little consolidation will take place taking the gold price to 890 levels. Trade with a sell position after the consolidation for a good profit booking.

Today's trend: Up
Next target: Unsure

Gold extended its losses yesterday as long liquidation continued with the move accentuated by technical sell stops being hit. In addition, talk of potential IMF gold sales definitely didn't help pushing gold to an intraday low of $864.80/oz with a loss of 20.95 dollars for the day. A strengthening US dollar and fading inflation concerns also prompted investors to book profits in gold. It seems that participants feel more optimistic about an economic recovery after G20 meeting so on the short term gold will probably struggle to regain upside momentum given the renewed risk appetite.

The short term trend is bearish while the medium and long term trends are bullish.

Support: $864.80 (yesterday's low)
Resistance: $913.30 (high of 11/03/09)

Support: $851.90 (low of 23/01/09)
Resistance: $909.85 (high of 03/04/09)

Support: $843.25 (low of 22/01/09)
Resistance: $896.97 (yesterday's high)

candelstick chart, technical indicators, share market, stock market, commodity market, accurate forecast, daily gold forecast
9 day moving average - $909.30
14 day moving average - $921.00
40 day moving average - $932.74

Sunday, April 5, 2009

Today's forecast is sideways movement for gold.

Well, prices will find strong support at 920 targeting 938. But later in the day, prices have possibility to fall sharply. So, good profit booking either up or down.

Next target: Unsure
Today's trend for gold: Sideways

Gold finished sharply lower yesterday in reaction to equities continuing their recent rally as traders unwound some safe-haven positions in the metal. As the Dow Jones climbed back above 8000 for the first time in nearly two months gold fell further with the move being accentuated by technical selling. Some analysts noticed the sell off in gold despite moves in two other markets that normally favour the yellow metal – a weaker US dollar and stronger crude oil.

The short term trend is sideways while the medium and long term trends are bullish.

Support: $901.15 (yesterday's low)
Resistance: $945.32 (high of 26/03/09)

Support: $900.00 (psychological level)
Resistance: $936.15 (high of 27/03/09)

Support: $882.90 (low of 18/03/09)
Resistance: $907.92 (yesterday's high)

Wednesday, April 1, 2009

Today's forecast- Buy gold below 920 with a target of 938.

Gold has consolidated quite a lot and is perfectly poised for the big move. So, it is good to buy and hold it until an initial target of 938 is hit.

Next target: 938
Today's trend: Up

We saw an 'Inside Day' pattern in gold yesterday with a lower high and a higher low engulfed by the previous day range. The yellow metal started the day higher as investors appeared to be using the recent pullbacks as an opportunity to establish long positions again helped also by a weaker US dollar and a stronger crude oil. But later on gold fell, closing near flat as the dollar bounced from its weakest levels and crude gave back the early gains. So overall, the trading session was one of a choppy consolidation which could be set to stay on the same course ahead of ECB and G20 meetings on Thursday.

The short term trend is sideways while the medium and long term trends are bullish.

Support: $908.55 (yesterday's low)
Resistance: $945.32 (high of 26/03/09)

Support: $906.55 (low of 12/03/09)
Resistance: $936.15 (high of 27/03/09)

Support: $904.85 (low of 03/03/09)
Resistance: $924.50 (yesterday's high)

candelstick chart, technical indicators, share market, stock market, commodity market, accurate forecast, daily gold forecast
9 day moving average - $930.33
14 day moving average - $930.39
40 day moving average - $934.79